Telco
Improve the efficiency of your operations and extract value from your data through GIS technologies.
Contact usDo you have a challenge and don't know how to face it?
![]()
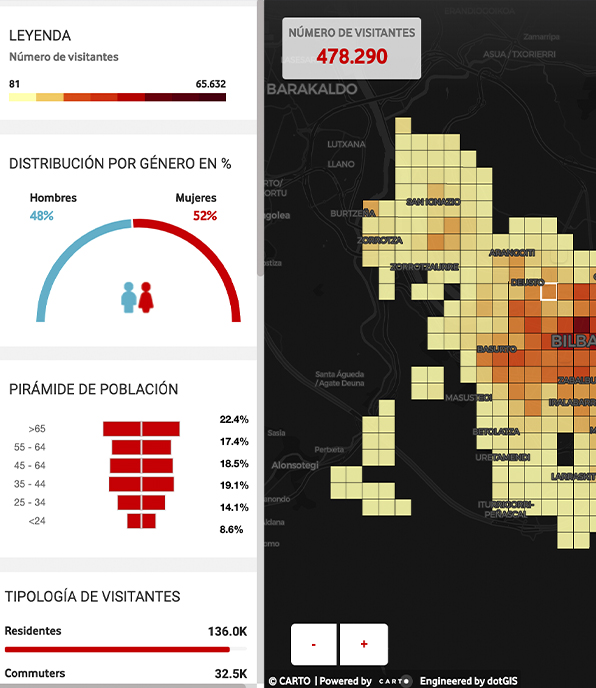
Market analysis
swipe ![swipe]()
Optimize your sales force
Optimize your sales force by analysing the environment, prioritise your marketing actions and focus your efforts on those locations with the greatest market potential.
Sales Forecast
Do sales forecasting based on historical data and market environment conditions.
Understand your target audience
Understanding your target audience is essential and so is analysing their demographics, like where they work, live or spend time.
Market Power
It identifies, on the basis of geolocalised data, which areas have the greatest market potential, profit margin and accessibility.

Site slection
swipe ![swipe]()
Facility Design
Facility design, using GIS tools, is a very reliable resource for the analysis of white zones for the deployment of communication networks.
Dashboard with descriptive KPIs
We combine your business data with GIS data from the environment to create a location intelligence solution. All that information is placed all into a dashboard with descriptive KPIs, which allows you to review, compare and create reports based on up-to-date data.
Compare locations
You will be able to compare locations and discover the areas that meet the optimal indicators to boost your business.
Twin Areas Analysis
Mediante técnicas de Location Intelligence, podrás realizar un análisis gemelar de manera visual e intuitiva, evaluando las ubicaciones actuales de tu empresa, las de tus competidores y nuevas ubicaciones.
Optimal locations
Identify the factors that are driving or holding back your business, and discover the optimal locations that have the best conditions for your business to thrive. Make data-driven predictions when expanding or optimising your networks.
Smart cities
swipe ![swipe]()
Asset digitization
Using real-time asset digitalization, with all the information in a simple and intuitive dashboard, allows you to identify trends or patterns of previous behaviour, track and control what is currently happening, and make future predictions.
Dashboards of IoT data analysis
IoT centralises and integrates all available information in very intuitive viewers and query tools through a data analysis dashboard for more agile access to the vast amount of data being collected.

latest news
Principales tendencias en el sector logístico y desafíos de cara a 2023
Whitepaper
Con el aumento del comercio mundial, el sector de la logística ha experimentado un incremento de...
Guía práctica para la optimización y desarrollo de centros comerciales
Whitepaper
¿Qué está sucediendo en el sector de los centros comerciales? ¿En qué medida han afectado los...
GISEANDO CON...Vodafone, IBM y Secmotic
Webinar
De “Cities” a “Smart cities”: El reto de digitalización que aún no cumplen muchas ciudades. No...
Do you have a challenge and don't know how to face it?